Prediction
By showcasing personalized products or collections in empty shopping carts, shoppers are more likely to uncover items that resonate with their preferences, ultimately leading to increased conversion rates.
 |
Potential uplift of 5% to 7% in CR. |
Setting up the experience on Visually:
BUILD TIME: 7-10 MINUTES
Step 1 - Set the scope
Start by defining the specific conditions and parameters required to trigger the experience.

Audience → select 'Custom Audience' → set the following condition:
CART ITEMS COUNT : IS : 0

Pages → make sure that the experience is set to ‘All Pages’, since the cart drawer is a site-wide element.

Devices → select ‘Mobile Only’.

Trigger (Optional) → Select ‘Element Appearing’ and reference the specific cart drawer selector. This adjustment excludes sessions without an empty cart panel appearing for precise session analysis.
In case you’re unsure about this, default to ‘Page Load’.

Step 2 - Set the content
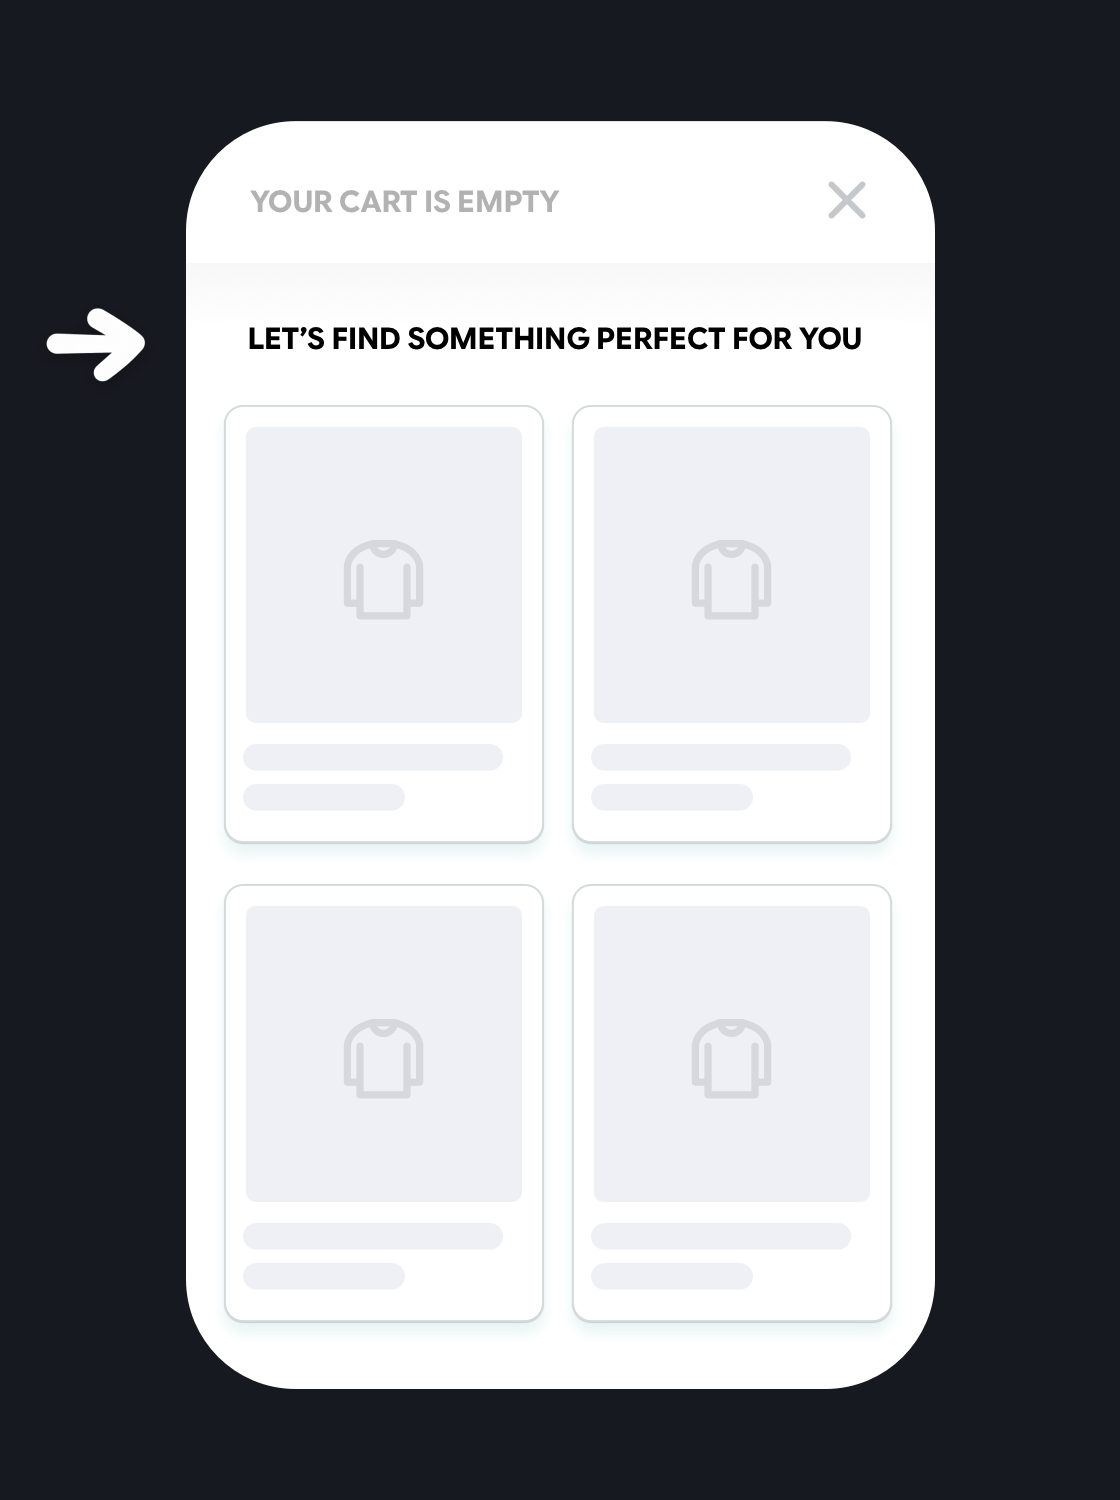
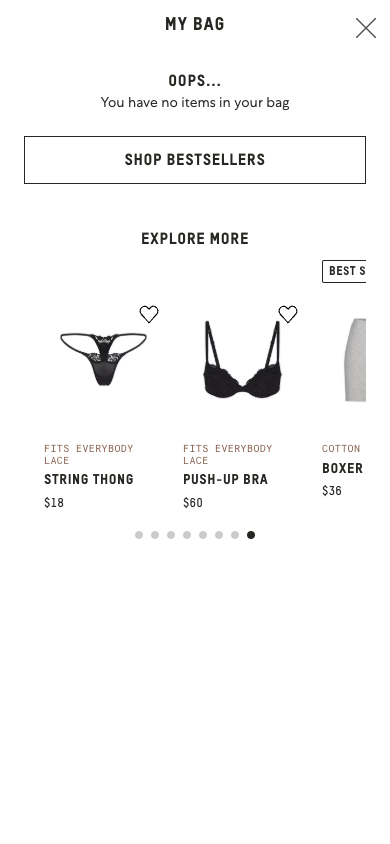
Clear the cart → remove all items from the cart displayed in the preview window, if applicable. This will enable you to modify the empty cart state.
Next, eliminate any unnecessary content from the empty cart that does not serve the experience, such as superfluous links or text.


Add a text block → insert a 'Text' content block beneath the cart header and type "YOUR CART IS EMPTY" → adjust the design → click 'Save'.

Add links to collections → add a 'Columns' content block below the text block (you can create up to three columns per row, although we recommend using two for optimal presentation), and click 'Save'.


Add content to the links → include content for the CTA text, background image, as well as the CTA and image links.

Tailor the design → adjust the design with your brand identity.
Additionally, we suggest to save your styling selections for future use (for more information on reusing styles, refer to this article).


Duplicate & Populate→ duplicate the column block to accommodate the desired number of collections, and customize the content and design of the new columns accordingly.

Apply changes to all pages → ensure that all modifications are set to display on 'Mobile All Pages' so that the experience is consistently applied across the site.

Finalize → click on 'Save', assign a name to your experience, provide a description if needed, then click 'Next'.

Step 3 - Preview & QA
In order to make sure that the experience is working properly prior to publishing, we highly recommend running a QA session using our preview feature.
- Click on ‘Preview’ → ‘Share’ → ‘Copy Link’.
- Use this link on a mobile device and browser for a more accurate insight (we recommend running this test on an incognito session, in order to clear up any cookies that might impact the process).
- For more information about running quality assurance via Visually, check out this article.
Step 4 - Finalize & Publish
We recommend conducting an A/B validation to evaluate the impact of this experience on your store's performance.
To begin → click on ‘Next’.
Initiate an A/B test → navigate to section 3 and select ‘Yes, sure’.

Name your variation(s) → we suggest naming variations based on the hypothesis you’re testing and how they differ from each others, such as:
- Original / Categories
- Original / Columns
- Categories / Products
- 2 PER ROW / 1 PER ROW
- Original / Friendly / Professional

Determine the allocation → we suggest starting with a 50/50 split to obtain results quickly and reliably.
- If you prefer to conduct a preliminary sanity check, consider a 80/20 allocation for initial validation, then transition to 50/50 for comprehensive testing.
- Keep in mind that achieving statistical significance may take several days, especially with lower allocations. For guidance on analyzing and monitoring your A/B tests, refer to this article.

Set the metric goals → click on ‘+’ to select goals → for this experience, we recommend the following KPIs:
- Conversion Rate
- Average Order Value
- Per Session Value
- Product Details Views Rate
- Click-Through Rate
Set the primary metric → we recommend setting ‘Conversion Rate’.
Send metrics to GA4 (optional) → check the box for ‘Send events to Google Analytics’.

Publish the experience → click on ‘Publish’ and confirm when ready.
 Watch our step-by-step walkthrough video
